Arboretum Landscape Teaching Aid Series: Forest Met Prairie (3.19510)
Date: 1940 – 1960Creator: Watts, May Theilgaard
Type: Drawing
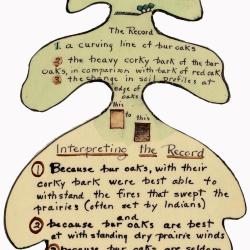
Description:Primarily textual teaching aid depicting Arboretum landscape. This material is depicted in the shape of a bur oak leaf. It describes how a line of bur oaks indicates where the climax forest and climax prairie met.
Header: FOREST met PRAIRIE [illustration of grass and trees]
Text and illustrations from top to bottom:
- The Record
- 1. a curving line of bur oaks
- 2. the heavy corky bark of the bur oaks, in comparison with bark of red oak.
- 3. the change in soil profiles at edge of oaks this [illustration of soil] to this [illustration of darker soil]
- Interpreting the Record
- 1) Because bur oaks, with their corky bark were best able to withstand the fires that swept the prairies (often set by Indians) and
- 2) because bur oaks are best at withstanding dry prairie winds
- 3) because bur oaks are seldom found in the heart of the woods
- We Read that: this line of bur oaks marks the place where the climax forest met the prairie climax
Extent: 1 sheet

Education charts: The Northwoods (3.34179)
Type: Photographic image
Description:An educational chart created by May T. Watts for The Morton Arboretum, depicting a Northwoods association. A detailed illustration of a single tree leaf is positioned at the center of the chart, surrounded by four vingnettes showing additional flora and fauna found within the ecological community.
Header: THE NORTHWOODS
Labels from top to bottom, left to right:
- bunchberry
- hermit thrush
- red pine
- white-tailed deer
- white pine / hemlock
Extent: 1 slide
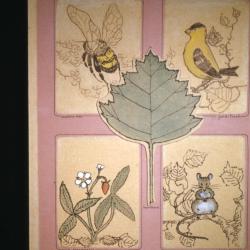
Education charts: Forest Margin and Fence Row (3.34182)
Type: Photographic image
Description:An educational chart created by May T. Watts for The Morton Arboretum, depicting a forest margin and fence row association. A detailed illustration of a single tree leaf is positioned at the center of the chart, surrounded by four vingnettes showing additional flora and fauna found within the ecological community.
Header: FOREST MARGIN and FENCE-ROW
Labels from top to bottom, left to right:
- bumble-bee
- gold-finch
- hawthorn
- wild strawberry
- deer-mouse
Extent: 1 slide

Education charts: Beech-Maple Climax (3.34226)
Type: Photographic image
Description:An educational chart created by May T. Watts for The Morton Arboretum, depicting a beech-maple climax forest association. A detailed illustration of a single tree leaf is positioned at the center of the chart, surrounded by four vingnettes showing additional flora and fauna found within the ecological community.
Header: BEECH-MAPLE CLIMAX
Labels from top to bottom, left to right:
- wood sorrel
- oven bird
- beech
- chipmunk
- hemlock / sugar maple
Extent: 1 slide

Forest Margin (3.34292)
Type: Photographic image
Description:A poster of the forest margin, created by May T. Watts for The Morton Arboretum, featuring locations with the highest bird populations. The poster depicts airbrushed color silhouettes of a row of trees with various birds perched in them, and spring flowers depicted in a row beneath.
Extent: 1 slide
1992/06/02: Gary Watson to Chris Whelan (3.44242)
Date: June 2 1992Creator: Watson, Gary W.
Type: Document
Description:Memo from Gary Watson to Chris Whelan concerning East Woods research, education, and management.
Extent: 1 sheet
1991/05/29: Zhang Cheng Lin to Dr. Ross Clark (3.57368)
Date: May 29 1991Creator: Cheng Lin, Zhang
Type: Document
Description:Letter from Zhang Cheng Lin to Dr. Ross Clark discussing his earlier research papers written during his studies to achieve his BA and Master's in Forest Ecology and his desire to obtain his PHD in the United States.
Extent: 4 sheets
Morton Forestry Plots: Minirhizotrons and Roots (3.63437)
Date: 2019Type: Dataset
Description:Minirhizotron tubes were installed in 18 Forestry plots covering 13 species around The Morton Arboretum in the early summer of 2018. Beginning in spring of 2019, images are being collected on a roughly bi-weekly to monthly time scale from the tubes using a minirhizotron camera. From these images, the seasonal growth patterns and lifespan of fine roots can be monitored.
Final datasets will be made free and publicly accessible through the Fine-Root Ecology Database (FRED; http://roots.ornl.gov/). Raw data may be made available with reasonable request.
Morton Forestry Plots: Dendrometer Bands and Woody Stems (3.63438)
Date: 2019Type: Dataset
Description:"TreeHugger" Digital dendrometers were installed on 87 trees across the 18 core Forestry Plots in April of 2019. From these, measurements of stem diameter will be recorded every 15 minutes continuously across the year. The measurements have an accuracy of approximately 50 microns, enabling the monitoring of both seasonal patterns of stem growth as well as diurnal patterns of stem shrinking and swelling associated with water loss and gain within the tree trunk.
Raw and cleaned data may be made available from the Root Lab with reasonable request. Final datasets will also be housed at Oak Ridge National Laboratory.
Morton Forestry Plots: Phenocams and Leaves (3.63439)
Date: 2019Type: Dataset
Description:Time-lapse "Phenocams" (Trail Cams) have been installed around the Arboretum targeting the 18 core Forestry Plots. These cameras capture a series of images of the leaf canopy 5 to 24 times each day throughout the year. The recorded images will then be analyzed by the field-specific software, PhenocamW64, which will estimate a greenness index representing the timing of leaf production, senescence, and relative density of tree canopy across the year.
Raw and clean data may be made available from the Root Lab with reasonable request. Final datasets will also be housed at Oak Ridge National Laboratory.